Leveraging Data Mining for Enhanced Coal and Gas Outburst Prediction in Mining Operations
Henry Campbell 1
|
[1] Quantum Tech Institute - Australia, henrycampbell782@gmail.com, https://orcid.org/0009-0008-9664-2425
|
|
|
|
Copyright: © 2022 by the authors. This article is an open access article distributed under the terms and conditions of the Creative Commons
Received: 14 March, 2022
Accepted for publication: 26 April, 2022
|
ABSTRACT
The safety of mine production is significantly jeopardized by coal and gas outburst accidents. In order to enhance the scientific precision of predicting coal and gas outburst risks, a system software (V1.2.0) was developed using the C/S architecture, Visual Basic development language, and SQL Server 2000 database. The statistical process control (SPC) method and logistic regression analyses were employed to evaluate and establish the critical value of outburst risk for individual indices, such as the S value of drill cuttings and the K1 value of the desorption index. Through a multivariate information coupling analysis, the interrelation of outburst warnings was explored, leading to the derivation of the outburst risk prediction equation. Subsequently, the SPC and logistic regression analysis methods were applied to typical mines. The results demonstrated the accurate determination of sensitivity values for each borehole depth using the SPC method, with a 94.7% accuracy rate achieved by the logistic regression method. These methodologies prove to be valuable for the timely detection of outburst hazards during mining operations.
Keywords: mine safety; predictive modeling; risk assessment
|
||
Aprovechamiento de la Minería de Datos para una Mejora en la Predicción de Desprendimientos de Carbón y Gas en Operaciones Mineras
RESUMEN
La seguridad en la producción minera se ve significativamente comprometida por accidentes de desprendimientos de carbón y gas. Con el fin de mejorar la precisión científica en la predicción de los riesgos de desprendimientos de carbón y gas, se desarrolló un software de sistema (V1.2.0) utilizando la arquitectura cliente/servidor, el lenguaje de programación Visual Basic y la base de datos SQL Server 2000. Se emplearon el método de control estadístico de procesos (SPC, por sus siglas en inglés) y análisis de regresión logística para evaluar y establecer el valor crítico de riesgo de desprendimiento para índices individuales, como el valor S de los recortes de perforación y el valor K1 del índice de desorción. A través de un análisis multivariado de acoplamiento de información, se exploró la interrelación de las alertas de desprendimientos, lo que condujo a la derivación de la ecuación de predicción de riesgo de desprendimiento. Posteriormente, se aplicaron los métodos de control estadístico de procesos y regresión logística a minas típicas. Los resultados demostraron la determinación precisa de los valores de sensibilidad para cada profundidad de perforación utilizando el método SPC, con una tasa de precisión del 94.7% lograda mediante el método de regresión logística. Estas metodologías demuestran ser valiosas para la detección oportuna de peligros de desprendimientos durante las operaciones mineras.
Palabras clave: seguridad minera; modelado predictivo; evaluación de riesgos
INTRODUCTION
In recent years, there has been rapid development in new energy sectors such as nuclear energy, wind energy, and solar energy, leading to a diversified trend in China's energy landscape. Despite this, coal resources continue to serve as a pillar in China's energy system due to their maturity, reliability, and cost-effectiveness, playing a crucial role in the sustainable development of the national economy. Consequently, ensuring coal mine safety is pivotal for sustaining China's economic progress.
Throughout the coal mining process, various natural risks pose threats to the safety of coal mine production, including fire [1,2], partial or complete collapse of the mine roof [3], and coal and gas outbursts [4–6]. Additionally, diverse geological structures impact the safety of coal mine production [7]. Coal and gas outbursts, categorized as hazards in the coal mining process, involve sudden movements of coal and gas during underground mining operations, accompanied by dynamic sound phenomena and powerful force effects [8]. Factors influencing coal and gas outbursts include in-ground stress, gas presence, and the mechanical properties of coal.
Presently, two primary hypotheses explain the mechanism behind coal and gas outbursts—the "energy" theory and the "uneven stress distribution" theory. The former posits that coal outbursts result from the sudden release of energy, where the elastic energy accumulated in the coal mass causes its rupture, and high gas expels the broken coal. The latter theory suggests that geological structures cause uneven stress distribution in the surrounding rock of the coal seam, leading to stress release and subsequent destruction of the coal mass.
Although the duration of coal and gas outbursts, from occurrence to completion, is brief, their destructive capacity is significant, causing damage to the coal wall and mining face equipment. China faces a notable challenge in this regard, having experienced numerous outbursts. The earliest recorded outburst in China dates back to 20 November 1939, with a coal quantity of 7 tons in the Fuguo 2 well of the Source Mining Bureau. The most extensive outburst occurred on 8 August 1975, in the Sanhui Mining area of Chongqing Tianfu Mining Bureau, involving 12,780 tons of coal and rock, along with 140,000 m3 of gas outburst. Ukrainian coal mines have also documented over 11,000 coal and gas outbursts, exemplified by the incident at the Yu. A. Gagarin mine in Donetsk in 1969, where the coal and gas volume reached 14,500 tons, the outburst lasted 32 seconds, and the speed reached tens of meters per second [9–11].
To ensure the secure operation of mines and enhance economic gains, it is imperative to proactively prevent outbursts, with the prediction of outburst risk serving as the foundation for such prevention. This poses a critical challenge within the realm of mine safety, and the pursuit of reliable means and methods to achieve precise predictions of outburst risk is fundamental to effectively preventing and managing outburst disasters, as well as optimizing the development and utilization of gas resources. The application of data mining technology aids decision-makers in scrutinizing historical and current data, revealing concealed relationships and patterns. Furthermore, it enables the anticipation of potential future behaviors, analysis of information regarding the genesis, preparation, and occurrence processes of coal and gas outbursts, and its application to outburst risk prediction. Consequently, the significance of data mining technology lies in improving the accuracy of outburst risk prediction and mitigating the incidence of accidents [12].
In recent years, numerous scholars have delved into research on the prediction of coal and gas outbursts, presenting various prediction methods categorized as single-index and multiple-information coupling methods [13,14]. The single-index method involves comparing the value of a selected single index with the predetermined critical value of coal and gas outbursts to ascertain the likelihood of accidents occurring [15]. While this method facilitates straightforward predictions, its accuracy is subpar, and determining the critical value of the prediction index proves challenging. Commonly utilized prediction methods in surveyed mines include the number of drilling cuttings [16], initial gas emissions [17], initial gas desorption characteristics [15], debris index [18], and gas desorption index [19]. Outburst risk is determined by collecting and comparing corresponding indices during drilling operations. However, in the analysis of outburst accidents, instances often arise where the prediction of a single index fails to indicate an outburst, but an actual outburst occurs. Hence, the selection of the outburst prediction index and its sensitivity necessitates further investigation and analysis.
Given that coal and gas outbursts are complex dynamic phenomena influenced by various factors, scholars have increasingly turned their attention to predicting them using multivariate information coupling methods [20]. The multiple-information coupling prediction method involves analyzing multiple indices to comprehend the relationships between various factors affecting coal and gas outbursts. Scholars have constructed different prediction models using approaches like multiple regression analysis [21], attribute mathematics [22], extension theory [14], and structural equations [23]. Zheng et al. [24] optimized the parameters of eXtreme Gradient Boosting (XGBoost) through a grid search and metaheuristic algorithm, achieving 100% prediction accuracy for outbursts in the testing phase. Liu et al. [25] introduced a least-squares support vector machine (LSSVM) for prediction and employed an improved particle swarm optimization (IPSO) algorithm, resulting in a model with a relative error of less than 2.7%. Wu et al. [26] optimized support vector machine (SVM) coal and gas outburst prediction algorithms by combining the IPSO algorithm with the IPSO-Powell algorithm. Wang et al. [14] established an outburst risk prediction system and a risk grade index value system based on extension theory. Shu et al. [27] approached the initiation conditions of an outburst from a mechanics and energy perspective, proposing a key structural model through the analysis of spatial geological structures. Ru et al. [28] used a correlation coefficient to fill in missing data, identified abnormal data based on the Pauta criterion, and employed a random forest model to predict coal and gas outbursts. Although the multiple-information coupling prediction model has become a predominant research direction, it still encounters limitations, such as the requirement for extensive sample data optimization and a slow calculation speed.
Drawing upon both domestic and international studies on the prediction of coal and gas outbursts and carefully weighing the merits and drawbacks of existing forecasting techniques, this investigation employed the statistical process control (SPC) method to ascertain the critical value of sensitivity indices. The dynamic phenomenon of outbursts was then translated into a logistic regression method for a comprehensive analysis that considered each individual index alongside the outburst dynamic phenomena. Ultimately, stress prediction for coal and gas outbursts in representative mines was conducted using both the SPC method and logistic regression analysis.
Prediction of Coal and Gas Outburst Using Data Mining Technology
Establishment of the Critical Range for Sensitivity Indices
Within the realm of mathematical statistics, each sensitivity index can be considered safe for production within a specific numerical distribution range. Conversely, any abnormal data lying beyond this distribution range holds the potential to pose future dangers. Thus, defining this distribution interval becomes a pivotal method for assessing sensitivity index values. In the process of examining and evaluating an individual index's existing state and forecasting the associated risk, surpassing the normal inspection data range implies the presence of outburst risk. "Anomalous data" are meticulously scrutinized to anticipate the likelihood of an accident, with the requirement of applying Statistical Process Control (SPC) to all data during the screening phases. SPC finds widespread application in quality control within manufacturing enterprises with similar processes [29]. The control chart, created using a systematic approach to measure, record, and regulate process quality, comprises a centerline (CL), upper control limit (UCL), lower control limit (LCL), and a chronological sequence tracking the values of sample statistics (refer to Figure 1 for an illustrative example of the control chart).

Figure 1 illustrates a sample control chart.
In this investigation, µ ± 3σ was chosen as the control range. The selection of 3σ for calculating the control line in Statistical Process Control (SPC) is closely tied to the process capability index. The formula for our process capability index uses 3σ as the denominator, and a control level of ± 3σ achieves a 99.73% confidence level, fully meeting the engineering site requirements [29].
Prediction of Coal and Gas Outburst Risk Using Multivariate Information Coupling
Limitations of the Single-Index Method
In practical outburst prediction efforts, it was observed that the prediction of a single index often targeted a specific worksite during the detection process. However, most existing prediction methods are based on drilling operations, which involve the construction of advanced drills in front of the working face before drilling or mining. This includes the analysis and inspection of the coal body in front and the data characterizing the size of the risk. In the actual operational process, the selection of the drilling location is significantly influenced by human factors, including:
(1) Varied borehole indices: In the process of designing the drilling location, the drilling location can differ due to workplace restrictions or varying experience levels of practitioners. Consequently, the index data obtained from each borehole during construction may be uneven and sometimes contradictory.
(2) Issues with drilling construction quality: The depth to which advance drilling can reach is greatly affected by the geological conditions of the coal mine and the working attitude of employees. Drilling may sometimes fail to reach the predetermined depth or be constructed according to the design angle, resulting in a significant drilling deviation. This can lead to non-representative coal samples, making it challenging to truly verify the risk ahead.
(3) Narrow range of obtained forecasts: The prediction of outburst risk through drilling operations has limitations, as the stress state and gas occurrence in front of the working face change with the distance from the working face. Additionally, drilling may not reach a considerable depth and breadth, constraining the range of obtained forecasts.
Prediction through Multivariate Information Coupling
The concept of multiple-information coupling entails that, in the practical process of predicting outbursts, the judgment of outburst risk doesn't solely rely on a single index value. Instead, various factors are taken into consideration, including geological elements, coal structure, burial depth, and diverse dynamic phenomena observed during drilling.
Outburst dynamic phenomena, such as coal bursts, gas fluctuations, gas anomalies, spray roofs, drill clamping, and sloughing slagging, serve as indicators reflecting the comprehensive gas situation within the coal seam, the ground stress situation, and other relevant information in the vicinity of the working face. Consequently, dynamic phenomena don't merely signify a test point but offer insights into the outburst danger across the entire working area. To address the limitations of single-index prediction, incorporating dynamic phenomena to aid in outburst risk prediction proves effective. However, during the recording process, reliance on staff judgment for outburst dynamic phenomena leads to qualitative data recording. Qualitative indexes, known for their forecasting challenges and lack of a standardized description, are challenging to implement. Hence, the primary challenge when utilizing this condition for forecasting lies in quantifying the outburst dynamic phenomenon.
The intensity of an outburst is a crucial metric for characterizing the extent of harm caused by such an incident, directly expressing the level of danger. To establish the risk coefficient (T), data on the nationwide relationship between coal mine outburst intensity and precursory signs are collected. The risk coefficient (T) for different outburst signs is obtained through normalization of the statistics. This normalization involves dividing the average outburst intensity corresponding to each type of outburst dynamic phenomenon by the sum of the average intensity of all types of outburst dynamic phenomena.
For practical on-site operations, various outburst signs are categorized into three levels: severe, moderate, and mild. The determination of whether an outburst phenomenon falls into the severe, moderate, or mild outburst grade is made by experienced workers. The severity level of the outburst is detailed in Table 1 based on different circumstances.
Table 1. Classification of the severity of different dynamic outburst phenomena.

The severity level aligns with the severity coefficient, where a severe severity level corresponds to a severity coefficient of 2, a moderate level corresponds to a coefficient of 1, and in mild cases, the severity coefficient is 0.5.
Definition: The magnitude of outburst risk associated with different outburst dynamic phenomena is denoted as the degree of outburst risk (D).
![]()
In the provided context, D represents the degree of outburst risk associated with different outburst dynamic phenomena. Ty denotes the severity of outburst consequences corresponding to various types of outburst dynamic phenomena, and ξ represents the severity coefficient of the outburst dynamic phenomena.
Development of the Logistic Regression Model
The technique of jointly analyzing each single index and the outburst dynamic phenomenon to assess the risk of an outburst is commonly known as the point-and-surface combination method. Determining whether an outburst in front of the working face conforms to a standard second-class assessment or second-class score prediction (i.e., whether an outburst occurs or not) can be simplified to a second-class assessment regression analysis. In establishing the critical value of a single index, it has been validated that all influencing indexes follow a normal distribution. Consequently, regression analysis can be conducted using the conventional logistic regression analysis method for binary classification.
Logistic regression analysis, initially proposed by the Belgian scholar P.F. Verhulst in 1838, refers to regression analysis with the secondary score or secondary evaluation as the dependent variable. The probability of a coal and gas outburst is an event that changes with variations in each single index and outburst dynamic phenomenon, and its probability of occurrence lies between 0 and 1. The logistic function, employed for population estimation and prediction, is characterized by the following properties.

In this equation, where t represents time, p signifies the number of people at time t, L denotes the maximum limit value of p, and a and b are the relevant parameters. In its role as a population-prediction function, p consistently maintains a positive value. Adhering to the prerequisites of the nonlinear probability model, it becomes imperative to substitute p with the probability p = p (y = 1) and modify the upper limit L to 1. Consequently, this constrains the range of probabilities to a rational interval between 0 and 1. The resulting expression is the logistic probability function, formally defined as:

This formula emphasizes two valuable parameters: b and minus a/b. Insights from this function include the following observations:
- When b is positive, the logistic function exhibits a monotonic increase as x increases. Conversely, when b is negative, the logistic function demonstrates a monotonic decrease with increasing x. Therefore, b signifies the relationship between the independent variable x and the probability function. Similar to how the sign of the regression coefficient in multiple linear regression analysis determines the direction of the independent variable's effect, b also represents the direction of action of the independent variable in the logistic probability function.
- The value of a/b serves as the center of the curve, where the probability function reaches a value of 0.5, marking the midpoint between the values of the probability function. The function takes the inflection point (-a/b, 0.5) as the center of symmetry, exhibiting the highest rate of change of the curve at this point. As one moves farther away from this center, the rate of change of the curve diminishes when approaching the upper or lower limit of the function, and the rate of change becomes nearly zero.
- The greater the absolute value of b, the more rapidly the curve ascends or descends towards the middle. This implies that significant changes are concentrated in the vicinity of the corresponding inflection points on the X-axis.
In scenarios involving more than one independent variable, expressed as a linear combination a + b1 × 1 + b2 × 2 + ... + bk × k, and denoting z, the logistic function can be formulated as:

Additional deformation of it is acquired through the following process:

This represents a typical formulation for the logistic function. Subsequently, this expression undergoes further transformation into

In essence, the transformation involves expressing the probability of an event, originally presented as a nonlinear independent variable, into a function where the probability is expressed as a linear independent variable. The linear expression above introduces various functions related to the probability of events, defined as follows:
- Probability of event occurrence: p = p(y = 1).
- Probability of the event not occurring: 1 − p = (y = 0).
- Odds: p/(1 − p) = Ω.
The odds, interpreted as the occurrence ratio or relative risk in the given formula, represent the ratio between the probability of occurrence and non-occurrence. An occurrence ratio exceeding one suggests that the likelihood of an event is greater than 50%, and a higher occurrence ratio indicates a higher risk.
In the context of logistic regression, it is assumed that the relationship between the probability of event occurrence and the independent variable adheres to a logistic function distribution. This effectively confines the range of the regressive dependent variable between 0 and 1, continuously changing as the combined value z of the independent variable undergoes variations.
Implementation of System Software Functionality
In this investigation, the development of software (V1.2.0) was grounded in the C/S architecture, utilizing the Visual Basic development language, and employing the SQL Server 2000 database. The system functionalities encompassed user management, an accident database, data management, and prediction and evaluation. Within the prediction and evaluation functions, the SPC control chart method was employed to establish the critical value of a single sensitivity index, and logistic regression analysis was utilized to integrate the single sensitivity value index with dynamic outburst phenomena for the prediction of coal and gas outbursts. Figure 2 illustrates a functional diagram of the system software.
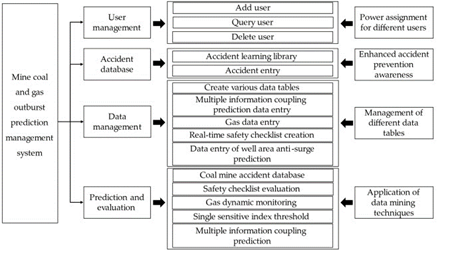
Figure 2 illustrates the functional diagram of the system software
Application of Data Mining Technology in a Representative Mine
Utilization of the Statistical Process Control Method to Determine the Critical Value of a Single Index
To establish the upper control limit for each index under a normal distribution, an SPC control chart was created for each index. Determining the upper control limit aids relevant department staff in analyzing measured data to assess the outburst risk at the working face. The experimental site for investigation and analysis was the Sihe mine in Jincheng City, Shanxi Province.
Situated on the southeast edge of the Qinshui coal field, the Sihe mine's industrial site is in Yinzhuang village, Jiafeng Town, Qinshui County, approximately 70 km away from Jincheng City. The mine, with a production capacity of 10.8 million t/a, is a typical high-gas mine with five recoverable coal seams, totaling 12.1 m in thickness. The main mining seam has an average thickness of 6.42 m, a 5◦ inclination angle, and a simple structure, making it conducive to good mining conditions. The main inclined shaft of the mine has a 16◦ inclination angle and a length of 763.5 m, the west main inclined shaft has a 16◦ inclination angle and a length of 981.1 m, and the auxiliary inclined shaft has a 19◦ inclination angle and a length of 575.44 m. The mine's design is based on an inclined-shaft panel area development mode and comprehensive mechanized mining.
The Sihe mine primarily employs the drilling operation method for predicting outburst risk. In the implementation process, the quantity index S of cuttings from coal samples at different drilling depths and the initial gas emission velocity K1 of coal samples serve as judgment indices for the coal outburst risk at the working face.
Figures 3–18 depict various charts related to drilling cuttings and initial gas emission velocity values for different drilling depths in the coal samples. Figures 3, 5, 7, and 9 display the control charts for the drilling cuttings amount (S value) of coal samples at drilling depths of 2 m, 4 m, 6 m, and 8 m, respectively. Figures 4, 6, 8, and 10 provide the frequency distribution charts for the same. Figures 11, 13, 15, and 17 present the control charts for the initial gas emission velocity (K1 value) of coal samples at drilling depths of 2 m, 4 m, 6 m, and 8 m, respectively, while Figures 12, 14, 16, and 18 showcase the frequency distribution charts for the same. These figures illustrate the control upper limits for the S value of drilling cuttings and the K1 value of the initial gas emission velocity in coal samples at different drilling depths.

Figure 3: Control chart for S value at a depth of 2 m
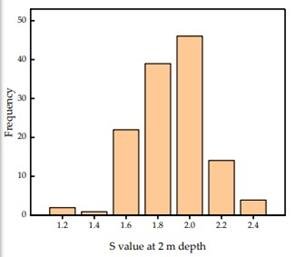
Figure 4: Frequency distribution chart for S value at a depth of 2 m
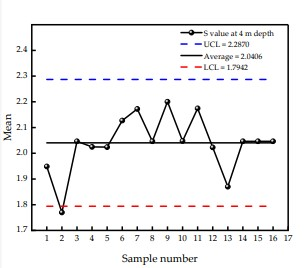
Figure 5: Control chart for S value at a depth of 4 m

Figure 6: Frequency distribution chart for S value at a depth of 4 m.

Figure 7: Control chart for S value at a depth of 6 m

Figure 8: Frequency distribution chart for S value at a depth of 6 m

Figure 9: Control chart for S value at a depth of 8 m

Figure 10: Frequency distribution chart for S value at a depth of 8 m
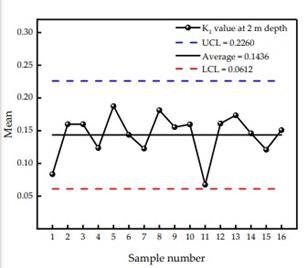
Figure 11: Control chart for K1 value at a depth of 2 m

Figure 12: Frequency distribution chart for K1 value at a depth of 2 m.

Figure 13: Control chart for K1 value at a depth of 4 m

Figure 14: Frequency distribution chart for K1 value at a depth of 4 m

Figure 15: Control chart for K1 value at a depth of 6 m

Figure 16: Frequency distribution chart for K1 value at a depth of 6 m

Figure 17: Control chart for K1 value at a depth of 8 m

Figure 18: Frequency distribution chart for K1 value at a depth of 8 m
Observing Table 2 reveals that, with an increase in drilling depth, both S and K1 values exhibit an initial rise followed by a decline. This trend is associated with the stress state ahead of the working face, providing validation for this theory. Through the SPC control chart and frequency distribution analysis of the data above, the control upper limit of an individual index, as derived from the control chart, holds a degree of representativeness and serves as a valuable reference, defining the sensitivity value of that single index. When any index surpasses its respective control limit during actual drilling operations, heightened vigilance and appropriate measures are necessary to prevent outbursts. Throughout this process, the statistical upper limit index is determined using the SPC control chart method, offering a profound understanding of the risk level at each drilling depth. This approach shifts away from the scenario where a critical value encompasses all drilling depths.
Table 2. Control upper limit value for single parameters and frequency ratio.

Application of Logistic Regression Analysis in Multivariate Information Coupling Prediction
Selection of Investigative Methods
To apply the logistic regression analysis method in the field, the Sanhui 1 mine of Chongqing Tianfu Mining Group was chosen, with the Sanhui 3 mine serving as the experimental site for examination. Sanhui mine represents a typical outburst-prone mine, with the shaft field of Sanhui 1 mine situated 680 m south of the 8# exploration line and above the level of +590 m. No recoverable protective layer K4 is present in the area located 2150 m north. The dip angle of the coal seam in the south area of the 8# exploration line ranges from 20° to 25°, while in the north area, it varies from 28° to 35°. The K1 coal seam, with an average thickness of 2.74 m, is mined along with the K3, K4, and K6 coal seams in the Sanhui 3 coal mine, all of which pose an outburst risk. The original gas content of the coal seams is 14.45 m3/t for the K1 coal seam, 11.02 m3/t for the K3 coal seam, 21.09 m3/t for the K4 coal seam, and 11.5703 m3/t for the K6 coal seam. Additionally, the gas pressures of the coal seams are 4.7~8.7 MPa for the K1 coal seam, 3.0 MPa for the K3 coal seam, and 2.44 MPa for the K4 coal seam.
The investigation and analysis of calculation results are crucial for determining the conformity of the calculation method with reality. In the actual drilling process of a mine, the occurrence of a dynamic phenomenon is considered to pose an outburst risk. However, when a single index is used for outburst prediction, it often happens that the value of the single index does not surpass the standard, yet a dynamic phenomenon is observed. Although the SPC control chart method is employed to control the upper limit of a single index, and the obtained control upper limit has mitigated this issue to some extent, it hasn't completely eliminated the phenomenon. Therefore, a comparison and analysis were performed between the results obtained from the investigation of multiple pieces of information, the results of the investigation of a single index, and the risk of the reaction of outburst dynamic phenomena. Judging the outburst risk was deemed necessary.
The "three-rate" method was utilized to analyze the outburst prediction data based on the prediction outburst rate, the prediction outburst accuracy rate, and the prediction non-outburst accuracy rate. This approach was employed to determine the outburst sensitivity index. An efficacy test was conducted to predict the outburst risk again after implementing outburst prevention measures. The same index was used to assess whether the outburst prevention measures proved effective. In the event of an outburst during the prediction process, the sensitivity index and its critical value could be determined based on the following "three rates":

Effect Investigation and Analysis
The dataset utilized for this investigation originated from the 21201-transportation lane of Sanhui 1 mine and 6402 of Sanhui 3 mine. Employing the multivariate information coupling prediction method, regression analysis was conducted, utilizing the multivariate information analysis function within the system function for regression probability calculation.
Subsequently, the outcomes of the regression prediction underwent scrutiny and analysis based on the three-rate method. The corresponding results are delineated in Table 3, providing a comparative overview of the analysis results using the "three-rate" method for prediction indices.
Table 3. Comparative Analysis Results Using the "Three Rate" Method for Prediction Indices.

The actual occurrence of outbursts refers to the real outburst risk identified during the drilling process, as indicated in the aforementioned table. Regarding the predicted concurrence of outburst occurrences, the K1 value predicts outbursts 22 times, the S value predicts outbursts only 3 times, and the multiple regression predicts outburst risks 21 times, while the actual number of outburst risk occurrences in the drilling process is 21 times. It can be observed that the multiple information regression predicts the most accurate number of outbursts, and the prediction based on the drilling chip quantity (S value) is the least accurate. When logistic analysis is employed for the coupling analysis of the single index and outburst dynamic phenomenon, the accuracy of outburst predictions using the single-index method increases from 77.27% to 94.7% based on the K1 value. As for the accuracy of non-outburst predictions, the results of multiple regression prediction show an increase, reaching 99.04%. It is evident that the multivariate information coupling prediction analysis, utilizing a single index combined with the outburst dynamic phenomenon, significantly enhances accuracy compared to the single-index method. When the prediction probability exceeds 50%, as calculated by the danger degree formula obtained through the logistic method, it is determined that there is a risk of outburst in the front. Appropriate measures should then be implemented to prevent dynamic phenomena in the drilling process in the next stage, thereby avoiding the occurrence of outburst accidents.
CONCLUSIONS
To ensure the sustainable mining of coal resources in an outburst mine, continuous prediction of coal and gas outbursts during the mining process is essential for safe production. Addressing the limitations of existing prediction methods, this study combines data mining technology characteristics with computer technology and the network architecture of coal mining enterprises. Through the application of relevant data management and mining technology to coal and gas outburst prediction work, the following conclusions are drawn from a comparative effect analysis:
When using a single index to predict the outburst risk in a coal mine site, the prediction index values at each borehole depth follow a pattern where the inspection index initially increases and then decreases after reaching the maximum value. Applying the SPC control method to analyze the upper control limit of the outburst index at the Sihe mine assists in establishing the sensitivity value of a single index under each borehole depth, facilitating timely discovery of danger warnings.
The logistic regression analysis method, applied to the measured data from Chongqing Tianfu Mining Group's Sanhui 1 mine and Sanhui 3 mine as inspection and verification indices, demonstrates significantly improved accuracy in outburst and non-outburst predictions. The breakthrough in accuracy for outburst risk prediction in front of the working face holds valuable practical application prospects.
BIBLIOGRAPHICAL REFERENCES
Luhar, K.A.; Emmerson, M.K.; Reisen, F. Modelling smoke distribution in the vicinity of a large and prolonged fire from an open-cut coal mine. Atmos. Environ. 2020, 229, 117471. [CrossRef]
Bosikov, I.I.; Martyushev, N.V.; Klyuev, R.V.; Savchenko, I.A.; Kukartsev, V.V.; Kukartsev, V.A.; Tynchenko, Y.A. Modeling and
Complex Analysis of the Topology Parameters of Ventilation Networks When Ensuring Fire Safety While Developing Coal and
Gas Deposits. Fire 2023, 6, 95. [CrossRef]
Gendler, S.G.; Gabov, V.V.; Babyr, N.V.; Prokhorova, E.A. Justification of engineering solutions on reduction of occupational traumatism in coal longwalls. Min. Informational Anal. Bull. 2022, 5–19. [CrossRef]
Młynarczuk, M.; Skiba, M. An Approach to Detect Local Tectonic Dislocations in Coal Seams Based on Roughness Analysis. Arch.
Min. Sci. 2022, 67, 743–756.
Kozieł, K.; Janus, J. Force Exerted by Gas on Material Ejected During Gas-geodynamic phenomena Analysis and Experimental
Verification of Theory. Arch. Min. Sci. 2022, 66, 491–508.
Black, J.D. Review of coal and gas outburst in Australian underground coal mines. Int. J. Min. Sci. Technol. 2019, 29, 815–824.
[CrossRef]
Gabov, V.V.; Zadkov, D.A.; Babyr, N.V.; Xie, F. Nonimpact rock pressure regulation with energy recovery into the hydraulic system of the longwall powered support. Eurasian Min. 2021, 36, 55–59. [CrossRef]
Yan, J.; Zhang, X.; Zhang, Z. Research on geological control mechanism of coal-gas outburst. J. China Coal Soc. 2013, 38, 1174–1178.
Ayruni, A.T. Prediction and Prevention of Gas-Dynamic Phenomena in Coal Mines; Nauka: Moscow, Russia, 1987.
Malyshev, Y.N.; Trubetskoy, K.N.; Airuni, A.T. Fundamental and Applied Methods for the Solution of Coal-Bed Methane Problems; Academy of Mining Sciences Publishing House: Moscow, Russia, 2000.
Sustainability 2023, 15, 11523 17 of 17
Rubinsky, A.A.; Mineev, S.P. The Main Patterns of the Manifestation of Powerful Gas-Dynamic Phenomena in Coal Mines; Donetsk
National Technical University: Donetsk Oblast, Ukraine, 2009; Volume 10, pp. 129–136.
Wang, E.; Zhang, G.; Zhang, C. Research progress and prospect on theory and technology for coal and gas outburst control and protection in China. J. China Coal Soc. 2022, 47, 297–322.
Cheng, Y.; Zhou, H. Research progress of sensitive index and critical values for coal and gas outburst prediction. Coal Sci. Technol.
2021, 49, 146–154.
Wang, W.; Wang, H.; Zhang, B.; Wang, S.; Xing, W. Coal and gas outburst prediction model based on extension theory and its application. Process Saf. Environ. Prot. 2021, 154, 329–337. [CrossRef]
Wang, C.; Li, X.; Xu, C.; Niu, Y.; Chen, Y.; Yang, S.; Zhou, B.; Jiang, C. Study on factors influencing and the critical value of the drilling cuttings weight: An index for outburst risk prediction. Process Saf. Environ. Prot. 2020, 140, 356–366. [CrossRef]
Sun, Z.; Li, L.; Wang, F.; Zhou, G. Desorption characterization of soft and hard coal and its influence on outburst prediction index.
Energy Sources Part A Recovery Util. Environ. Eff. 2020, 42, 2807–2821. [CrossRef]
Tang, J.; Wang, C.; Chen, Y.; Li, X.; Yang, D.; Liu, J. Determination of critical value of an outburst risk prediction index of working face in a coal roadway based on initial gas emission from a borehole and its application: A case study. Fuel 2020, 267, 117229.
[CrossRef]
Zhang, C.; Wang, E.; Xu, J.; Peng, S. A new method for coal and gas outburst prediction and prevention based on the fragmentation of ejected coal. Fuel 2021, 287, 11949. [CrossRef]
Liang, Y.; Wang, F.; Luo, Y.; Hu, Q. Desorption characterization of methane and carbon dioxide in coal and its influence on outburst prediction. Adsorpt. Sci. Technol. 2018, 36, 1484–1495. [CrossRef]
Xie, X.; Shu, X.; Fu, G.; Shen, S.; Jia, Q.; Hu, J.; Wu, Z. Accident causes data-driven coal and gas outburst accidents prevention:
Application of data mining and machine learning in accident path mining and accident case-based deduction. Process Saf. Environ.
Prot. 2022, 162, 891–913.
Li, Z.; Wang, E.; Ou, J.; Liu, Z. Hazard evaluation of coal and gas outbursts in a coal-mine roadway based on logistic regression model. Int. J. Rock Mech. Min. Sci. 2015, 80, 185–195. [CrossRef]
Ma, Y.; Wang, E.; Liu, Z. Study on the comprehensive evaluation model of attributes for coal seam outburst risk. J. Min. Saf. Eng.
2012, 29, 416–420.
Kursunioglu, N.; Onder, M. Application of structural equation modeling to evaluate coal and gas outbursts. Tunn. Undergr. Space
Technol. 2019, 88, 63–72. [CrossRef]
Zheng, X.; Lai, W.; Zhang, L.; Xue, S. Quantitative evaluation of the indexes contribution to coal and gas out-burst prediction based on machine learning. Fuel 2023, 338, 127389.
Liu, H.; Dong, Y.; Wang, F. Prediction Model for Gas Outburst Intensity of Coal Mining Face Based on Improved PSO and LSSVM.
Energy Eng. 2021, 118, 679–689. [CrossRef]
Wu, Y.; Li, H.; Xu, D. Prediction algorithm of coal and gas outburst based on IPSO-Powell optimized SVM. J. Mine Autom. 2020,
46, 46–53.
Shu, L.; Wang, K.; Liu, Z.; Zhao, W.; Zhu, N.; Lei, Y. A novel physical model of coal and gas outbursts mechanism: Insights into the process and initiation criterion of outbursts. Fuel 2022, 323, 124305. [CrossRef]
Ru, Y.; Lv, X.; Guo, J. Real-Time Prediction Model of Coal and Gas Outburst. Math. Probl. Eng. 2020, 2020, 2432806.
Xu, M.; Wei, P. SPC Evaluation Method and Application on Methane Control Effect of Fully Mechanized Working Face. Coal
Technol. 2016, 35, 118–120.