Identification of Flooded Regions through SAR Images and U-NET Deep Learning Model: A Case Study in Tabasco, Mexico
|
[1] Pacific Shores College - New Zealand, williamedwards081983@hotmail.com, https://orcid.org/0009-0001-9049-7086
|
|
|
|
Copyright: © 2023 by the authors. This article is an open access article distributed under the terms and conditions of the Creative Commons
Received: 24 August, 2023
Accepted for publication: 09 October, 2023
|
ABSTRACT Flooding is a prevalent issue worldwide, attributed to various factors such as climate change and land use. In Mexico, annual floods impact different regions, with Tabasco experiencing periodic inundations that result in significant losses across rural, urban, livestock, agricultural, and service sectors. Effective intervention strategies are essential for mitigating the repercussions of these floods. Consequently, diverse techniques have been developed to minimize the damage caused by this phenomenon. Satellite programs offer extensive data on the Earth's surface, complemented by geospatial information processing tools crucial for environmental monitoring, climate change analysis, risk assessment, and response to natural disasters. This research introduces an approach to classify flooded areas using synthetic aperture radar satellite images and the U-NET neural network. Focused on the Los Ríos region in Tabasco, Mexico, our preliminary findings demonstrate the effectiveness of U-NET, even with a limited training dataset. The model's accuracy improves with an increase in training data and epochs.
Keywords: Flooded regions; Climate change impact; Geospatial information processing
|
||
Identificación de Regiones Inundadas a través de Imágenes SAR y el Modelo de Aprendizaje Profundo U-NET: Un Estudio de Caso en Tabasco, México
RESUMEN
Las inundaciones son un problema prevalente a nivel mundial, atribuido a diversos factores como el cambio climático y el uso del suelo. En México, las inundaciones anuales impactan diferentes regiones, siendo Tabasco propenso a inundaciones periódicas que resultan en pérdidas significativas en los sectores rural, urbano, ganadero, agrícola y de servicios. Estrategias efectivas de intervención son esenciales para mitigar las repercusiones de estas inundaciones. En consecuencia, se han desarrollado diversas técnicas para minimizar el daño causado por este fenómeno. Los programas de satélites ofrecen datos extensos sobre la superficie terrestre, complementados con herramientas de procesamiento de información geoespacial cruciales para la monitorización ambiental, el análisis del cambio climático, la evaluación de riesgos y la respuesta a desastres naturales. Esta investigación presenta un enfoque para clasificar áreas inundadas utilizando imágenes satelitales de radar de apertura sintética y la red neuronal U-NET. Centrándonos en la región de Los Ríos en Tabasco, México, nuestros hallazgos preliminares demuestran la efectividad de U-NET, incluso con un conjunto de datos de entrenamiento limitado. La precisión del modelo mejora con un aumento en los datos de entrenamiento y las épocas.
Palabras clave: Regiones inundadas; Impacto del cambio climático; Procesamiento de información geoespacial
INTRODUCTION
Floods are natural occurrences observed worldwide, stemming from extreme weather conditions such as heavy rain, hail, snow, waves, or failures in hydraulic structures. Consequently, these events lead to elevated surface water levels in rivers, lakes, lagoons, or oceans, causing substantial damage to agriculture, livestock, and infrastructure. The associated costs bear a significant impact on both individuals and a country's economy [5]. Moreover, floods result in human casualties and often push vulnerable populations into poverty.
According to the United Nations Office for Disaster Risk Reduction (UNDRR), over 45% of the global population has experienced the effects of floods [32]. In Mexico, various regions, particularly the southern part of the country, consistently grapple with flood-related challenges [20]. These incidents are primarily linked to the rainy seasons spanning from May to November, leading to rising river levels and the overflow of their waters onto areas dedicated to productive activities or urban settlements. A notable instance occurred in November 2020.
The advancement of satellite platforms, coupled with increasingly sophisticated sensors and tools, has facilitated the collection of extensive Earth data, providing valuable insights [30]. Earth observation satellite programs have enabled numerous studies focused on flood detection, soil analysis, and monitoring natural damages, leveraging the potential of these technological developments.
Satellites acquire information with various properties, including spatial resolution (determining the Earth's surface area covered by each image pixel), spectral resolution (representing the electromagnetic spectrum captured by remote sensors), and temporal resolution (indicating how long satellite data can be obtained from the same location with the same satellite and radiometric resolution) [15].
One notable Earth observation satellite program is Copernicus, boasting significant capabilities in acquiring remote data with high temporal and spatial resolution, particularly beneficial for flood mapping. Comprising five satellites designed for diverse purposes, Copernicus includes Sentinel-1, offering Synthetic Aperture Radar (SAR) images for land and ocean observation; Sentinel-2, providing multispectral terrestrial optical images; Sentinel-3 and 6, designed for marine observation; and Sentinel-4 and 5, specializing in air quality monitoring [7, 29, 13].
While optical images exhibit variations dependent on cloud cover, hindering penetration through cloud layers during precipitation, SAR images rely on energy reflectance, making them effective both day and night. Consequently, SAR images remain unaffected by weather or atmospheric conditions, rendering them suitable for flood mapping and environmental monitoring. Various literature proposes different methods for detecting and monitoring water bodies, including the utilization of multispectral optical images and SAR data through supervised and unsupervised algorithms. Thresholding techniques, such as the Otsu method, are commonly employed for water body detection [19, 28].
However, challenges arise when perturbation factors influence SAR images' backscatter, potentially reducing effectiveness [16]. Additionally, optical imaging may face issues with threshold spectral indices due to the sensitivity of NIR (near-infrared) reflectance. In contrast, emerging in recent years are Deep Learning (DL) techniques, offering alternative approaches for overcoming these challenges.
The utilization of Synthetic Aperture Radar (SAR) images has given rise to innovative methods catering to diverse objectives, including land cover classification [25] and water body extraction [11]. A pivotal role in the automated analysis of remotely sensed images for locating and delineating specific areas has been played by semantic segmentation algorithms.
Convolutional Neural Networks (CNN), a subtype of Deep Learning (DL), have garnered widespread acceptance due to their superior performance and ease of training compared to other DL types [2]. Comprising multiple layers of processing resulting from spatial convolutions, CNNs are typically followed by trigger units. Concurrently, Recurrent Neural Networks (RNN) [27] have found applications in remote sensing, particularly for handling data sequences such as time series, where the output of the previous time step serves as input for the current step.
The emergence of Deep Convolutional Neural Networks (DCNN) has led to the proposal of various network models for segmentation tasks. Examples include pyramidal networks like PSP-Net [35], dilation convolution-based models such as DeepLab [6], and encoder-decoder architectures like HR-Net [26] and U-NET [27].
This study introduces a strategy for detecting and monitoring flooded areas using the U-NET deep learning model and Sentinel-1A SAR satellite images, focusing on the Ríos zone in the state of Tabasco, Mexico. The document follows a structured approach: Section 2 reviews related works, Section 3 outlines the materials and methods implemented in the investigation, Section 4 presents the obtained results, and Section 5 concludes the research findings.
Literature Review
The integration of Synthetic Aperture Radar (SAR) data and artificial neural networks, specifically convolutional neural networks (CNN), has been explored in various studies, proving effective in tracking land cover due to their exceptional ability to capture surface information irrespective of weather conditions.
In recent years, there has been a notable surge in research focused on analyzing, monitoring, and assessing damage caused by floods [4, 33]. Twele et al. [29] devised a fully automated processing chain for mapping flooded areas using Sentinel-1 images. Their approach, incorporating thresholding, the HAND index, and fuzzy logic-based classification, achieved an overall precision ranging from 94% to 96.1%, with a kappa coefficient between 0.879 and 0.91.
Studies conducted by Fernandez et al. [9] and Pech-May et al. [21] in Tabasco, Mexico, emphasized the analysis of SAR satellite images for monitoring terrestrial phenomena, highlighting the advantages of SAR images under cloudy and rainy conditions. Additionally, they developed a methodology leveraging machine learning to understand the behavior of floods during the rainy season.
Zhao et al. [36] employed convolutional networks and SAR images to classify urban features such as buildings, vegetation, roads, and bodies of water. Using TerraSAR images of Wuhan for training, they achieved a precision of 85.6% through horizontal image patches.
Scepanovic et al. [37] developed a land cover mapping system with 5 classes, employing pretrained deep learning semantic segmentation models with SAR Sentinel-1 imagery. Utilizing networks like UNet, DeepLabV3+, PSPNet, BiSeNet, SegNet, FCDenseNet, and FRRN-B, they achieved an overall precision of 90.7% with FC-DenseNet outperforming others.
Konapala et al. [14] presented a strategy for identifying floods from SAR satellite images, while Yu Li et al. [17] analyzed hurricanes using Sentinel-1 and Sentinel-2 imagery. Recurrent Neural Networks (RNN) are increasingly utilized for water body and land cover analysis with Sentinel images [3, 12]. Approaches proposed in [24, 18, 31] incorporate recursive and convolutional operations for spatiotemporal data processing.
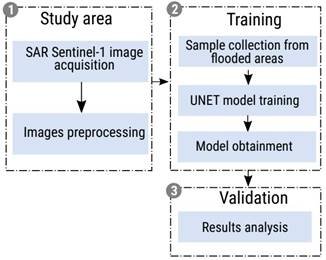
Fig. 1 illustrates the suggested approach for flood mapping utilizing SAR images and the U-NET model
MATERIALS AND METHODS
The proposed methodology encompasses three key phases, as depicted in Figure 1, illustrating each activity within these phases. The breakdown of each stage is elucidated below.
Study Area
Tabasco, situated in the southeast of Mexico along the Gulf of Mexico coast, occupies the 34th position in terms of national surface area, covering 24,661 km², equivalent to 1.3% of the country's total territory.
The entity comprises two recognized regions: Grijalva and Usumacinta, housing two subregions—swamps and rivers. Collectively, they constitute one of the largest river systems globally, measured by volume. Notably, the state experiences an average precipitation three times higher than the national average, contributing almost 40% of the country's freshwater.
The region's hydrology is significantly impacted by abundant water resources and the influence of dams, disrupting the natural flow of rivers and leading to flash floods. These floods, in turn, adversely affect drinking water, public health, and the well-being of numerous inhabitants [8]. Consequently, the occurrence of flooding in the region is a common phenomenon.
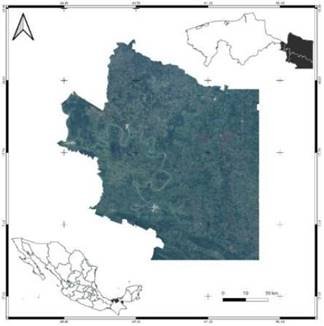
Fig. 2: Geographical positioning of the study area in the Los Ríos Subregion, Tabasco
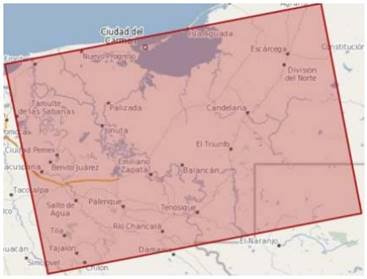
Fig. 3: Tile location housing the SAR images for the study area
However, in the autumn of 2020, a series of cold fronts and hurricanes led to the most severe flooding in decades, resulting in significant human and economic losses.
The focal point of this study is the Ríos subregion (refer to Figure 2), situated in the eastern part of the state and bordering the state of Campeche and the Republic of Guatemala. Named for its numerous rivers, including the Usumacinta River (the country's largest) and the San Pedro Martir River, the subregion encompasses the municipalities of Tenosique, Emiliano Zapata, and Balancan. Covering an area of approximately 6000 km², this represents 24.67% of the entire state.
Image Acquisition
For flood mapping, cross-polarized (VH) SAR images from the Sentinel-1 satellite were obtained via the Copernicus Open Access Hub2 platform. These images are part of a tile covering the states of Campeche, Chiapas, and Tabasco (see Figure 3). The selected images correspond to the periods of November 2020 and September 2022, aligning with instances of medium-scale floods in the study area. Additionally, the flood map estimated by the National Civil Protection System (SINAPROC-MEXICO) was utilized.
SAR Image Preprocessing
To mitigate distortions, flaws, or interference caused by noise in the SAR images, preprocessing steps were implemented (refer to Figure 4):
- Radiometric correction: This correction addressed distortions in the radar signal resulting from movements of the sensor or instrument aboard the satellite. It's important to note that the intensity of image pixels is directly related to the backscattering signal captured by the sensor. Figure 4a and 4b provide an example of an image before and after correction.
- Speckle filter application: Speckle filtering, designed for non-Gaussian multiplicative noise, was applied to address the salt-and-pepper effect caused by pixel values not following a normal distribution. The 7x7 Lee filter was utilized to standardize the image and reduce this issue (see Figure 4c).
- Geometric calibration: SAR images may exhibit distortion or rotation, necessitating rearrangement. Geometric correction was achieved using the Digital Elevation Model (DEM) from the Shuttle Radar Topography Mission (SRTM)3. Figure 4d illustrates the rearrangement of the SAR image in the study area.
- RGB layer generation: An RGB mask of the SAR image was created to identify pixels corresponding to bodies of water, vegetation, and flooded areas. Figure 4e displays the outcome of the image with the RGB layer.
- Binary layer: To differentiate water from other elements, a threshold was applied. The histogram of the filtered backscattering coefficient from the preprocessed images was analyzed, and minimum backscattering values were extracted—indicating pixels with water presence.
Figure 4f demonstrates the binary layer obtained through thresholding. Areas with red hues signify the presence of water, while other objects are disregarded. This layer is instrumental for creating training samples for the deep learning model, complemented by the 2020 flood map generated by SINAPROC.
Training
To train deep learning models effectively, it is necessary to convert Geographic Information Systems (GIS) data into a format suitable for image classification. The creation of high-quality training examples holds paramount importance in the training process of any deep learning or image classification model. For the labeling and training of the model, SAR images depicting floods in the study area from the year 2020 were employed.
Generation of Training Samples
Training samples were established using preprocessed images featuring the binary layer. Figure 5 illustrates a selection of training samples extracted from the SAR images.
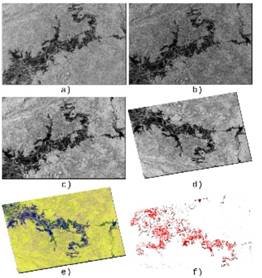
Fig. 4 presents an example of a SAR image, showcasing various stages of processing: (a) untreated, (b) after radiometric processing, (c) with speckle filter application, (d) following geometric correction, (e) incorporating the RGB layer, and (f) featuring the binary layer
After establishing the training samples, the data is exported to a format compatible with the model, incorporating the following parameters: 1) raster image, derived from the training sample locations; 2) image size set to 256 pixels; 3) offset distance for subsequent images, configured at 128 pixels; 4) metadata format in Classified Tiles type; and 5) image format in TIFF type. The outcome of this process comprises sets of small images of the sample sites (image chips), labels in XML format, a metadata file, along with parameters and statistics of the captured samples.
Training the Classification Model
This phase involved utilizing the Train Deep Learning Model geoprocessing tool. This tool facilitates the generation of a deep learning-based model using the compiled dataset of samples (image chips and labels) acquired during the training process.
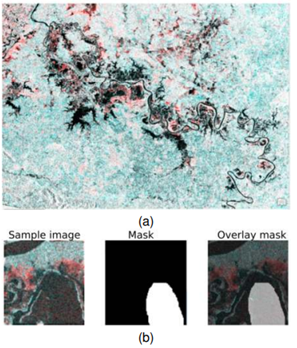
Fig. 5: Training Samples a) Image utilized in the generation of training samples, (b) A sample from one of the regions used in the training, along with the corresponding generated mask
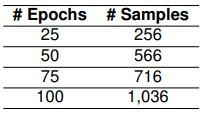
Table 1: Count of Samples and Training Iterations This table details the number of samples and iterations employed during the training of the flood classification model.
CNN U-NET models, despite their simplicity, were utilized due to their tendency to provide more accurate and refined results compared to other models. Several parameters were adjusted for the model training:
- Epochs: The maximum number of cycles or iterations for all training samples through the neural network. Different values were experimented with: 25, 50, 75, and 100 epochs.
- Processing Batch Size: The number of samples processed simultaneously, dependent on hardware specifications, number of processors, or available GPU. A value of 8 was chosen.
- Chip Size: Equivalent to the size of the images of sample sites or image chips, set at 256.
The ResNet-34 model served as the residual network or backbone [10], consisting of 34 pre-trained layers with data from the ImageNet database. Following the recommendation in [1], a validation data percentage of 10% was established, indicating the number of training samples used for model validation during the learning process.
It was decided that the learning process would persist even as the learning curve began to flatten. Training involved the U-NET model with SAR images. Table 1 provides details on the number of samples used for each implemented epoch.
The model's output comprises a file containing information about the generated model, including:
- Learning Rate: Magnitude of change or update in the model weights during the backpropagation of data by the neural network in the training process.
- Training and Validation Loss: Indication of how well the model fits the training and validation data.
- Accuracy: The average accuracy score represents the percentage of correct detections made by the model based on the results obtained with internal validation samples.
Validation
Training of the Classification Model
It's important to highlight that the results are interim, representing the performance of the classification model at each epoch during the training process.
- Training Algorithm Parameters: The ArcGIS platform, coupled with the PyTorch library, was utilized for training the neural network. The dataset's image size used for training was set at 256 x 256 pixels. Table 1 delineates the images used for training across epochs. Model parameters were initialized with a standard normal distribution. Parameter optimization employed binary cross-entropy to compare predicted values with actual ground values, and further optimization was performed using the Adam method [34]. Table 2 illustrates the outcomes from the neural model training, showcasing optimal results achieved with 1036 chips and 100 epochs, boasting a precision of 93%, recall of 92%, and F1 score of 93%.
- Flood Mapping: The detection of floods using SAR images yielded favorable results, contingent on the augmentation of training data and epochs. Notably, the model exhibited superior performance in detecting non-flooded areas due to the limited dataset for deep learning model training. Figures 6 and 7 display the results obtained in flooded areas detection, with the left image representing the ground truth and the right depicting the model's prediction at 25, 50, 75, and 100 epochs. Figure 7(b), corresponding to 100 epochs and 1036 training samples, particularly demonstrates enhanced flood detection. It's pertinent to mention that a larger dataset is currently under development for the model, aiming to achieve improved results in flood detection. Figure 8 illustrates the values obtained from the trained model concerning the data loss in validation and training.
Table 2: Count of Samples and Epochs in Flood Classification Model Training
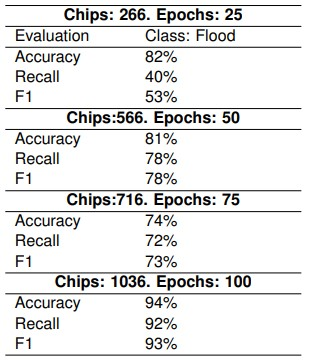
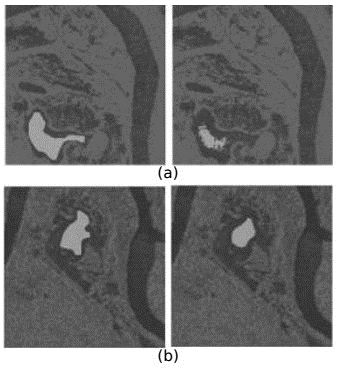
Fig. 6: Outcome of Trained Neural Model (a, b - left) Depicts the ground truth. (Right) Illustrates the model's prediction at 25 (a) and 50 (b) epochs, respectively
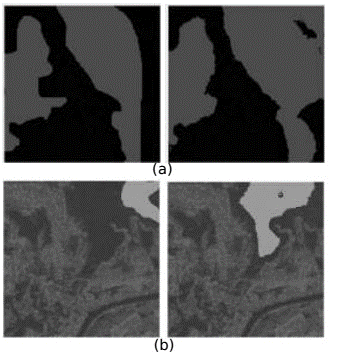
Fig. 7: Outcome of Trained Neural Model (a, b - left) Depicts the ground truth. (Right) Corresponds to the prediction of the model at 75 (a) and 100 (b) epochs, respectively
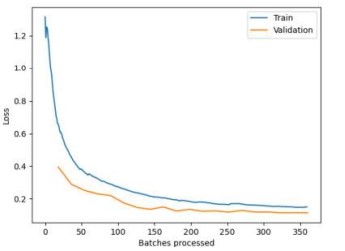
Fig. 8: Progression of Training Data Loss and Model Validation
CONCLUSIONS
The utilization of satellite data for flood detection necessitates a nuanced understanding of both flood characteristics and the data acquired by the satellite. This study revealed that noise in SAR images adversely affects flood mapping performance, necessitating image processing for noise correction.
Moreover, the employment of deep learning for flood detection emerges as an efficient approach in terms of time, cost, and performance. Particularly, when satellite SAR data is available during and after floods, this methodology proves invaluable for swiftly delivering flood mapping results in emergency scenarios.
In addition, UNet-type networks demonstrated efficiency in working with SAR images, even with minimal data. The model's accuracy showed significant improvement, escalating from 53% to a remarkable 93% F1 score as training data and epochs increased. Consequently, the results are deemed satisfactory, given the limited data with which the model underwent training.
As a final recommendation, there is a proposal to construct a more expansive dataset to enable the application of more intricate neural networks for the detection of flooded areas.
BIBLIOGRAPHICAL REFERENCES
1. Abd-Elrahman, A., Britt, K., Liu, T. (2021). Deep learning classification of high-resolution drone images using the ArcGIS pro software. Vol. 2021, No. 5, pp. 1–7. DOI: 10.32473/edis-fr444-2021.
2. Alzubaidi, L., Zhang, J., Humaidi, A. J., Al-Dujaili, A., Duan, Y., Al-Shamma, O., Santamar´ıa, J., A. Fadhel, M., Al-Amidie, M., Laith, F. (2021). Review of deep learning: Concepts, CNN architectures, challenges, applications, future directions. Journal of Big Data, Vol. 8, No. 53. DOI: 10.1186/s40537-021-00444-8.
3. Bengio, Y., Courville, A. C., Vincent, P. (2013). Representation learning: A review and new perspectives. IEEE Transactions on Pattern Analysis and Machine Intelligence, Vol. 35, No. 8, pp. 1798–1828. DOI: 10.1109/TPAMI.2013.50.
4. Bourenane, H., Bouhadad, Y., Tas, M. (2018). Liquefaction hazard mapping in the city of Boumerdes, Northern Algeria. Bulletin of ` Engineering Geology and the Environment, Vol. 77, pp. 1473–1489. DOI: 10.1007/s10064-017-1137-x.
5. Centro Nacional de Prevencion de Desastres ´ (2012). Inundaciones. ¿Que es una inundaci ´ on?, 1 ´ edition, pp. 1–5.
6. Chen, L. C., Papandreou, G., Schroff, F., Adam, H. (2017). Rethinking atrous convolution for semantic image segmentation. DOI: 10.48550/arXiv .1706.05587.
7. Chini, M., Pelich, R., Pulvirenti, L., Pierdicca, N., Hostache, R., Matgen, P. (2019). Sentinel-1 InSAR coherence to detect floodwater in urban areas: Houston and hurricane Harvey as a test case. Remote Sensing, Vol. 11, No. 2. DOI: 10.3 390/rs11020107. Computación y Sistemas, Vol. 27, No. 2, 2023, pp. 449–458 doi: 10.13053/CyS-27-2-4624 456 Fernando Pech-May, Julio Víctor Sánchez-Hernández, Luis Antonio López-Gómez, et al. ISSN 2007-9737
8. Cuevas, J., Enr´ıquez, M., Norton, R. (2022). Inundaciones de 2020 en Tabasco: Aprender del pasado para preparar el futuro. Technical report, Centro Nacional de Prevencion de Desastres. ´ 9. Fernandez-Ordo ´ nez, Y., Soria-Ruiz, J., Leblon, ˜ B., Macedo, A., Elva, M., Ram´ırez-Guzman, M. E., ´ Escalona-Maurice, M. (2020). Imagenes de radar ´ para estudios territoriales, caso: Inundaciones en Tabasco con el uso de imagenes SAR Sentinel-1A ´ y Radarsat-2. Vol. 11, No. 1, pp. 5–24.
10. Gao, M., Qi, D., Mu, H., Chen, J. (2021). A transfer residual neural network based on ResNet-34 for detection of wood knot defects. Forests, Vol. 12, No. 2. DOI: 10.3390/f12020212. 11. Gupta, D., Kushwaha, V., Gupta, A., Singh, P. K. (2021). Deep learning-based detection of water bodies using satellite images. 2021 International Conference on Intelligent Technologies (CONIT), pp. 1–4. DOI: 10.1109/CONIT51480.2021.9498442.
12. Ienco, D., Gaetano, R., Interdonato, R., Ose, K., Ho-Tong-Minh, D. (2019). Combining Sentinel-1 and Sentinel-2 time series via RNN for object-based land cover classification. IGARSS 2019 - 2019 IEEE International Geoscience and Remote Sensing Symposium, pp. 4881–4884. DOI: 10.1109/IGAR SS.2019.8898458.
13. Kant-Singh, K., Singh, A. (2017). Identification of flooded area from satellite images using hybrid Kohonen fuzzy C-Means sigma classifier. The Egyptian Journal of Remote Sensing and Space Science, Vol. 20, No. 1, pp. 147–155. DOI: 10.1016/ j.ejrs.2016.04.003.
14. Konapala, G., Sujay, K., Khalique-Ahmad, S. (2021). Exploring Sentinel-1 and Sentinel-2 diversity for flood inundation mapping using deep learning. ISPRS Journal of Photogrammetry and Remote Sensing, Vol. 180, pp. 163–173. DOI: 10.1016/j.is prsjprs.2021.08.016.
15. Labrador-Garc´ıa, M., Evora Brondo, J., Arbelo, ´ M. (2012). Satelites de teledetecci ´ on para la gesti ´ on´ del territorio. Proyecto SATELMAC.
16. Lee, S. U., Yoon-Chung, S., Hong-Park, R. (1990). A comparative performance study of several global thresholding techniques for segmentation. Computer Vision, Graphics, and Image Processing, Vol. 52, No. 2, pp. 171–190. DOI: 10.1016/0734-1 89X(90)90053-X.
17. Li, Y., Martinis, S., Wieland, M. (2019). Urban flood mapping with an active self-learning convolutional neural network based on TerraSAR-X intensity and interferometric coherence. ISPRS Journal of Photogrammetry and Remote Sensing, Vol. 152, pp. 178–191. DOI: 10.1016/j.isprsjprs.2019.04.014.
18. Marc, R., Marco, K. (2018). Multi-temporal land cover classification with sequential recurrent encoders. ISPRS International Journal of Geo-Information, Vol. 7, No. 4, pp. 1–18. DOI: 10.3390/ijgi7040129.
19. Ohki, M., Yamamoto, K., Tadono, T., Yoshimura, K. (2020). Automated processing for flood area detection using alos-2 and hydrodynamic simulation data. Remote Sensing, Vol. 12, No. 17. DOI: 10.339 0/rs12172709.
20. Paz, J., Jimenez, F., S ´ anchez, B. (2018). ´ Urge un manejo sustentable del agua en Tabasco. Technical report, Universidad Nacional Autonoma de M ´ exico y ´ Asociacion Mexicana de Ciencias para el Desarrollo ´ Regional A. C., Ciudad de Mexico. ´
21. Pech-May, F., Sanchez-Hern ´ andez, J. V., Jacinto, ´ H. G. S., Magana-Govea, J. (2021). ˜ Analisis de ´ zonas de cultivo y cuerpos de agua mediante el cálculo de ´ ´ındices radiometricos con im ´ agenes ´ Sentinel-2. Vol. 1, No. 24, pp. 48–59. DOI: 10.215 01/21454086.3601.
22. Ponmani, E., Saravanan, P. (2021). Image denoising and despeckling methods for SAR images to improve image enhancement performance: A survey. Multimedia Tools and Applications, Vol. 80, pp. 26547–26569. DOI: 10.1007/s11042-021-108 71-7.
23. Rudner, T. G., Rußwurm, M., Fil, J., Pelich, R., Bischke, B., Kopackov ˇ a, V., Bili ´ nski, P. ´ (2019). Multi3Net: Segmenting flooded buildings via fusion of multiresolution, multisensor, and multitemporal satellite imagery. Proceedings of the AAAI Conference on Artificial Intelligence, Vol. 33, pp. 702–709. DOI: 10.1609/aaai.v33i01.3301702.
24. Shi, X., Chen, Z., Wang, H., Yeung, D. Y., Wong, W. K., Woo, W. C. (2015). Convolutional LSTM network: A machine learning approach for precipitation nowcasting. Advances in Neural Information Processing Systems (NIPS 2015), Vol. 28.
25. Sirirattanapol, C., Tamkuan, N., Nagai, M., Ito, M. (2020). Apply deep learning techniques on classification of single-band SAR satellite images. Geoinformatics for Sustainable Development in Asian Cities, Springer International Publishing, pp. 1–11. DOI: 10.1007/978-3-030-33900-5 1.